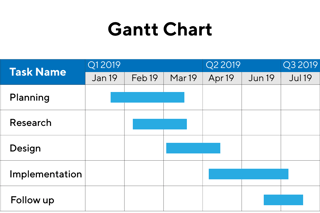
A Gantt chart is a bar chart that illustrates a project schedule. It was designed and popularized by Henry Gantt around the years 1910–1915. Modern Gantt charts also show the dependency relationships between activities and the current schedule status. From Wikipedia