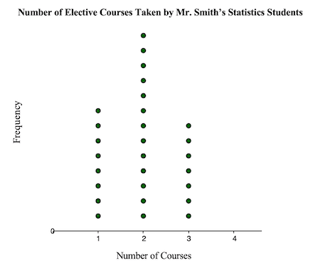
A dot chart or dot plot is a statistical chart consisting of data points plotted on a fairly simple scale, typically using filled in circles. There are two common, yet very different, versions of the dot chart. The first has been used in hand-drawn graphs to depict distributions going back to 1884. The other version is described by William S. From Wikipedia